Spirograph code in generativepy
- Categories:
- generative art
- geometric art
In this article we will see how to create Spirograph patterns in Python using generativepy.
As we saw in the introductory article, the points on the Spirograph curve are calculated using parametric equations, and the shape is controlled by three values a, b, and c.
The code
Here is the code to create a Spirograph pattern:
from generativepy.color import Color
from generativepy.drawing import make_image, setup
import math

from generativepy.geometry import Polygon, Transform

def create_spiro(a, b, d):
    dt = 0.01
    t = 0
    pts = []
    while t < 2*math.pi*b/math.gcd(a, b):
        t += dt
        x = (a - b) * math.cos(t) + d * math.cos((a - b)/b * t)
        y = (a - b) * math.sin(t) - d * math.sin((a - b)/b * t)
        pts.append((x, y))
    return pts


def draw(ctx, pixel_width, pixel_height, frame_no, frame_count):

    width = 32
    setup(ctx, pixel_width, pixel_height, width=width, startx=-width/2, starty=-width/2, background=Color(1))

    a = 14
    b = 6
    d = 4
    Polygon(ctx).of_points(create_spiro(a, b, d)).stroke(Color('red'), line_width=0.1)


make_image("spirograph.png", draw, 600, 600)
The function create_spiro creates a set of points that lay on the curve, using the parametric equations described in the introductory article. As we saw, the complete Spirograph often requires the curve to be calculated over several rotations. The number of rotations depends on a and b, and is given by b/gcd(a, b). Since each rotation is 2*pi radians, we must calculate points of t in the range zero to:
2*math.pi*b/math.gcd(a, b)
The loop calculates point fir t in increments of 0.01, which creates a smooth curve.
The function returns a list of all the points calculated.
The curve is drawn using the standard make_image function of generativepy. This uses a draw function to do the drawing, in the usual way.
In the draw function, we simply draw a polygon base on the calculated points. As noted above, because the points are so close together, the polygon appears to be a smooth curve.
Here is the result:
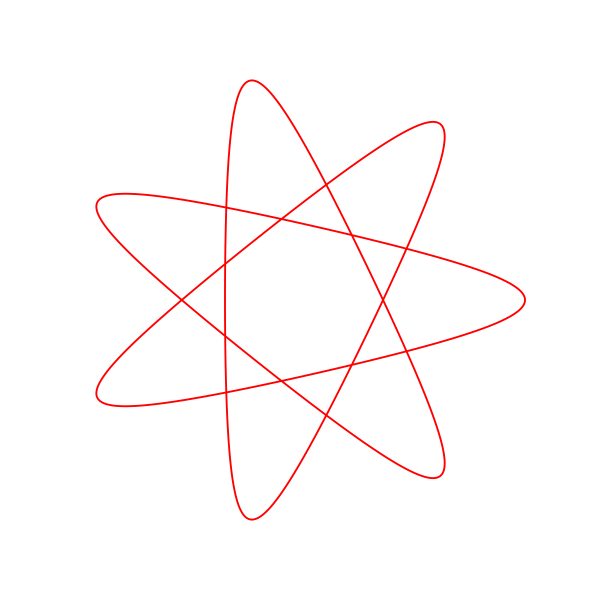
The code can be found on github in blog/geometric/spirograph.py.
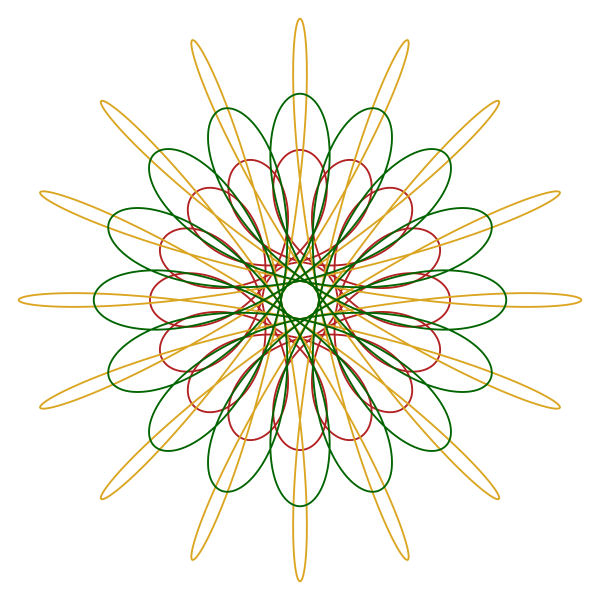
Variation - multiple plots
We can create more complex patterns by plotting multiple curves on the same image. We can use different a, b, or c numbers for each curve, and also try different colours. There are many possibilities.
The code is fairly easy, we just make multiple calls to the create_spiro function:
def draw2(ctx, pixel_width, pixel_height, frame_no, frame_count):

    width = 32
    setup(ctx, pixel_width, pixel_height, width=width, startx=-width/2, starty=-width/2, background=Color(1))

    a = 16
    b = 13
    d = 5
    Polygon(ctx).of_points(create_spiro(a, b, d)).stroke(Color('firebrick'), line_width=0.1)

    a = 16
    b = 9
    d = 8
    Polygon(ctx).of_points(create_spiro(a, b, d)).stroke(Color('goldenrod'), line_width=0.1)

    a = 16
    b = 11
    d = 6
    Polygon(ctx).of_points(create_spiro(a, b, d)).stroke(Color('darkgreen'), line_width=0.1)


make_image("spirograph2.png", draw2, 600, 600)
Here is the result:
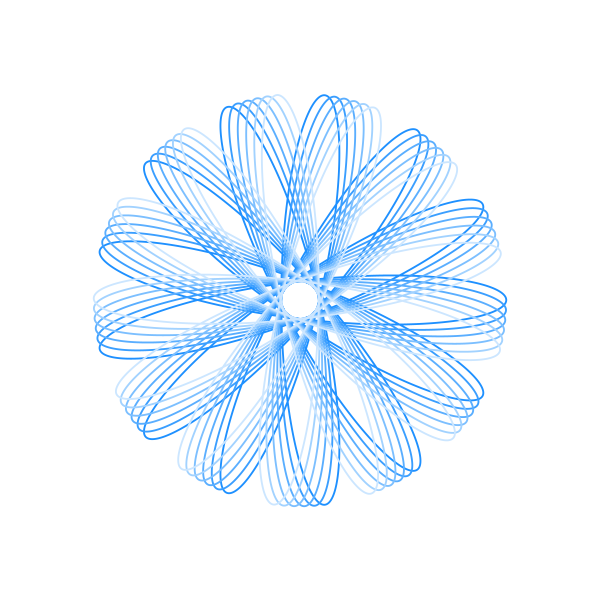
Variation - rotated curves
Another possible variation is to draw the exact same curve multiple times, but rotate it a little each time. In the code below we use a loop to draw the same curve 6 times, rotating it by 0.05 radians (about 3 degrees) each time:
def draw3(ctx, pixel_width, pixel_height, frame_no, frame_count):

    width = 32
    setup(ctx, pixel_width, pixel_height, width=width, startx=-width/2, starty=-width/2, background=Color(1))

    for i in range(6):
        a = 13
        b = 7
        d = 5
        with Transform(ctx).rotate(0.05*i):
            Polygon(ctx).of_points(create_spiro(a, b, d)).stroke(Color('dodgerblue').with_l_factor(1.1**i), line_width=0.1)


make_image("spirograph3.png", draw3, 600, 600)
To add a bit more interest, we also change the colour slightly:
Color('dodgerblue').with_l_factor(1.1**i)
This sets the basic colour to the CSS named colour dodgerblue, but it then adjusts the lightness of the colour by calling with_l_factor. This creates a lighter version of the same colour.
Here is the result: