Spirographs
- Categories:
- generative art
- geometric art
Spirograph is a toy that uses plastic cogs and a ballpoint pen to plot complex patterns.
In these articles, we will learn how to create Spirograph patterns with generativepy.
Spirographs
Here is a Spirograph toy:
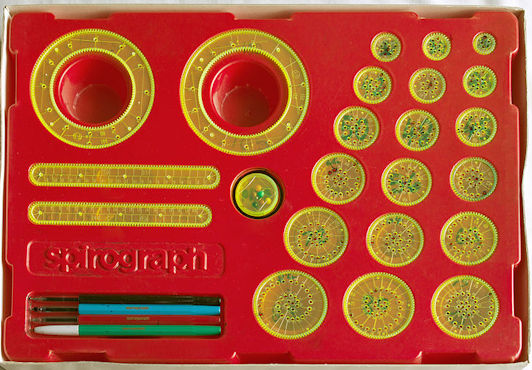
Image by Multicherry
One of the large plastic rings positioned on a piece of paper on a flat corkboard and held in place with pins. One of the smaller plastic circles is placed inside the plastic ring. A ballpoint pen is pushed through one of the holes. As it pushes the plastic circle around the inside of the plastic ring, the pen traces out a pattern (often a rose-like shape). Depending on the size of the plastic circle, and which hole you put the pen in, this can create a variety of different shapes. You can also overlay multiple patterns, perhaps in different colours, to make more complex designs.
How Spirograph patterns work
Here is an animation of a Spirograph pattern being created:
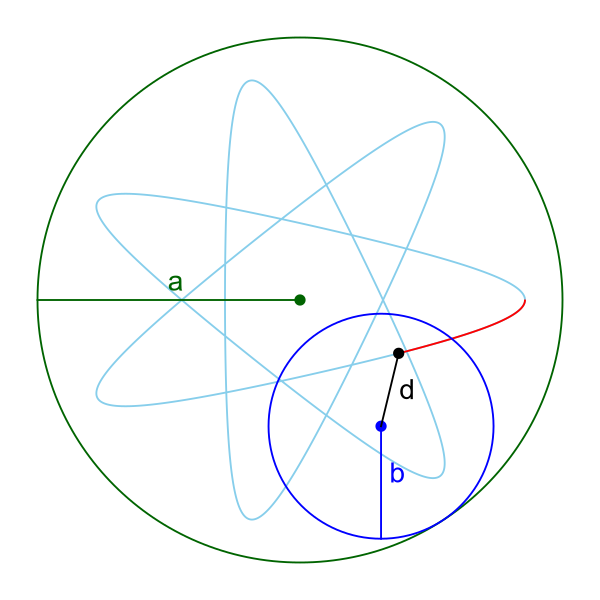
The basic idea is that we have a large circle of radius a and smaller circle of radius a that rolls around inside it. The pen, at a distance a from the centre of the smaller circle, traces out the curve. This diagram shows the dimensions a, b, and d:
Hypotrochoid curve
A Spirograph curve is a type of hypotrochoid curve. This curve uses the following parametric equations:
x = (a - b) * cos(t) + d * cos(t*(a - b)/b)
y = (a - b) * sin(t) - d * sin(t*(a - b)/b)
Here a, b and d are the constants above. These are parametric equations, using the parameter t.
The parameter t represents the angle of the centre of the smaller circle.
We can plot a the curve by choosing various values of t and plotting the points (x, y). This is shown below for the first few points:
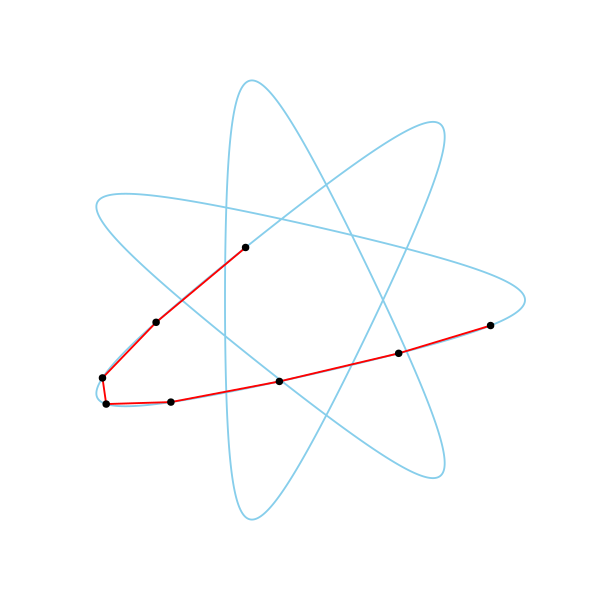
For illustration, we have spaced the points out quite a lot. The points shown correspond to t values of 0.5, 1.0, 1.5 and so on. The points all lay on the curve, but when we join the b points with straight lines the curve doesn't look smooth.
In the final curve we use t values of 0.01, 0.02, 0.03 etc. Because the points are very close together, even if we join them with straight lines it still looks like a smooth curve.
Multiple rotations
Take another look at the animation at the start of the article. The small blue circle rotates around the inside of the large green circle, drawing the curve as it goes.
But if you watch carefully, you will see that the curve isn't complete after the first rotation. That is because, although the small circle has arrived back in its original position, the blue dot that traces out the curve is in a different place. The blue circle has to go round 3 times before the blue dot arrives back at its original position.
In fact, the number of rotations depends on the value of a and b in a less than obvious way. To create a complete curve, the inner circle needs to go round a total of b/gcd(a, b) times, where GCD is the greatest common divisor function. The gcd function returns the largest number that divides into a and b.
In the case shown, a is 14 and b is 6. The GCD of 14 and 6 is 2 (both numbers are divisible by 2 but no larger number). So the number if rotations is b/2 which is 3.