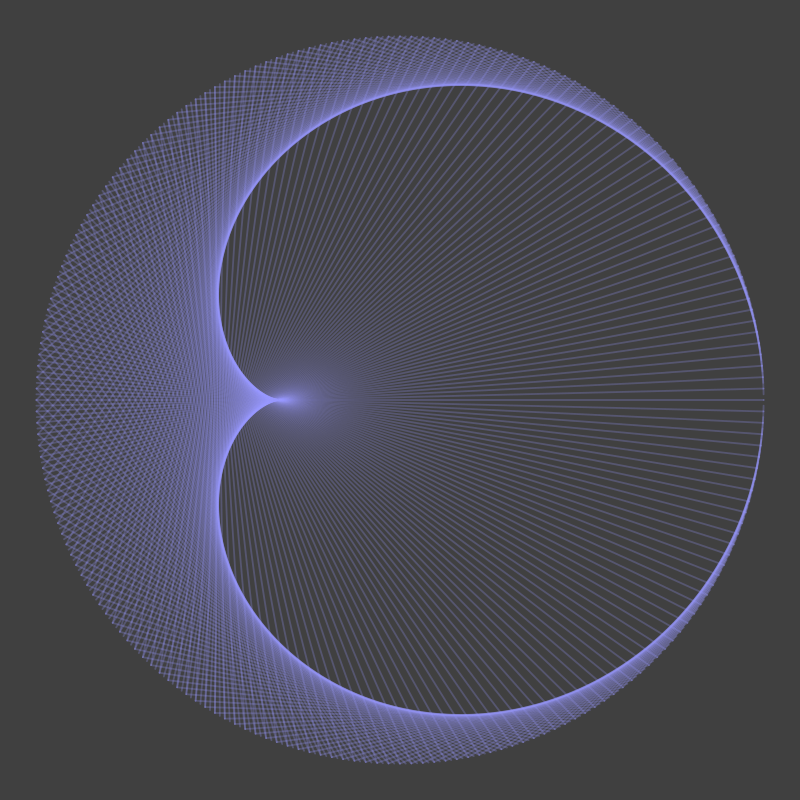
Cardioid string art with generativepy
In this post we will look at how to create an image like this using Python and generativepy:
To follow this tutorial you will need Python3.5 or above, generativepy, pycairo and numpy.
Making a cardioid curve
This type of curve is often created using pins and string, but it can be done by drawing lines on a computer image.
We start out with a set of points distributed equally around the circumference of a circle:
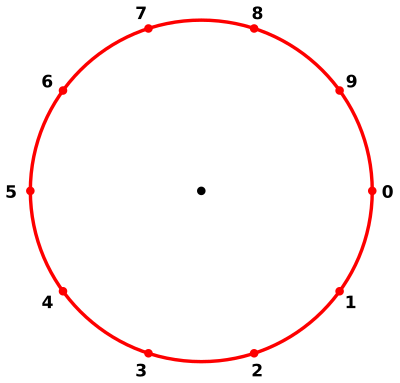
In this case we have 10 points, but in the image at the start of this post there are 200 points.
We will assume that the points are on a circle of radius 1 unit, with its centre at the point (0, 0). The (x, y) coordinates of point i are given by:
a = i*2*math.pi/N
x = math.cos(a)
y = math.sin(a)
N is the total number of points (10 in this case). a is the angle of the point around the circle, measured in radians. The points are numbered 0 to 9.
To create the image, we simply draw a line from each point i to the point 2*i:
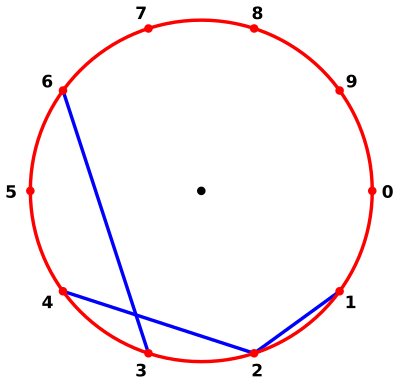
So:
- Point 0 is connected to point 0 (the line has zero length so it isn't drawn)
- Point 1 is connected to point 2
- Point 2 is connected to point 4
- Point 3 is connected to point 6
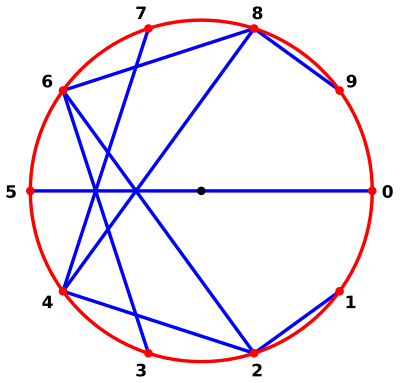
When we calculate the second point, we use modulo N, so:
- Point 5 is connected to point 0 (10, modulo 10)
- Point 6 is connected to point 2 (12, modulo 10)
- Point 7 is connected to point 4 (14, modulo 10)
Here is the complete drawing. Believe it or not, when you increase the number of points to 200, you will see a cardioid curve:
Drawing images with generativepy
Here is how we create a PNG image in generativepy:
makeImage("line.png", draw, pixelSize=(500, 500), width=2.2,
          startX=-1.1, startY=-1.1, background=Color(0.25))
This will create an image file line.png.
draw is a function object that we will provide that does the actual drawing, see later.
pixelSize sets the size of the image in pixels.
width, startX and startY set the user coordinate system, as described below.
background sets the background colour to 0.25 grey (a dark grey).
User coordinates
The pixel image we create will be 500 pixels square. We measure the x position from left to right, and the y position from top to bottom.
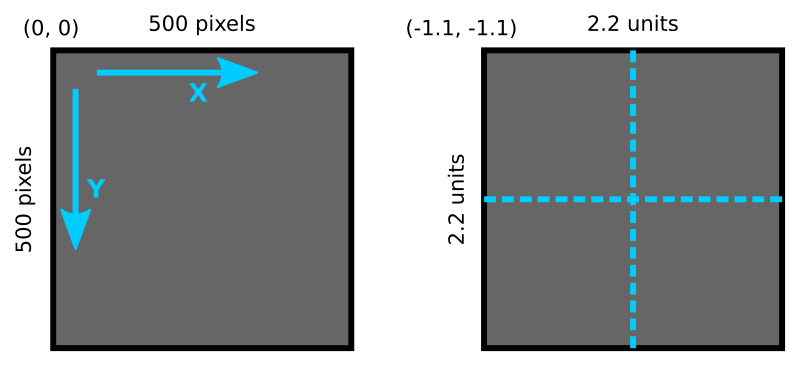
It is often useful to define user coordinates. This has two advantages. Firstly, we can choose a convenient scale. Secondly, if we want to change the pixel size of the image, we can simply change the pixelSize parameter. The drawing code, defined in user coordinates, doesn't need to change at all.
We set the width to 2.2, which means that 2.2 user units map on to 500 pixels. The height is chosen automatically to match the aspect ratio of the pixel size - the image is square so the height is also 2.2.
We have also set the startX and startY values to -1.1, which means that the top left of the image corresponds to user coordinate (-1.1, -1.1). The bottom right is coordinate (1.1, 1.1). The user coordinate origin, (0, 0) is exactly in the centre of the image.
Why have we chosen this size? Well our cardioid image will be based on a circle of radius 1, which will fit right in the middle of our 2.2 unit square, with a bit of space around the edges.
The draw function
To do the actual drawing, we must define a draw function. You can call it anything, but we will call it draw. It must take one parameter, a generativepy Canvas object. Here is our draw function:
def draw(canvas):
canvas.stroke(Color(0.6, 0.6, 1))
canvas.strokeWeight(0.01)
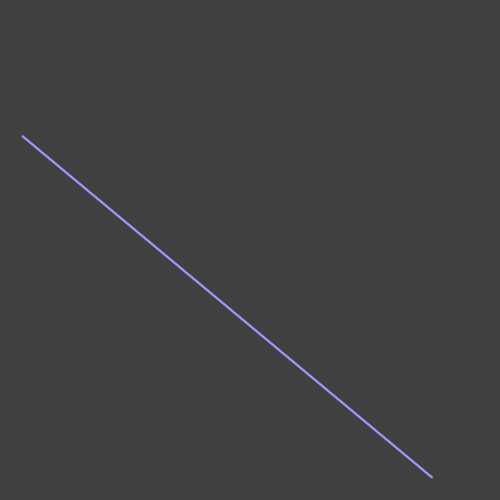
canvas.line(-1, -0.5, 0.8, 1)
This function calls several methods of the Canvas object:
strokesets the colour of any lines we draw.Color(0.6, 0.6, 1)gives rgb values of 0.6, 0.6 and 1.0, which is a light blue colour.strokeWeightsets the thickness of any lines drawn. It is measured in user coordinates. Since the whole image is only 2.2 units wide, we obviously must use quite a small value for the line width. You can experiment, but 0.01 is a good starting point.linedraws a line from position (-1, -0.5) to position (0.8, 1), again in user coordinates.
Here is the image:
And here is the full code:
from generativepy import drawing
from generativepy.drawing import makeImage
from generativepy.color import Color

def draw(canvas):
    canvas.stroke(Color(0.6, 0.6, 1))
    canvas.strokeWeight(0.01)
    canvas.line(-1, -0.5, 0.8, 1)

makeImage("line.png", draw, pixelSize=(500, 500), width=2.2,
          startX=-1.1, startY=-1.1, background=Color(0.25))
Drawing the cardioid image
We have seen how to draw a straight line with generativepy. And we have seen that the cardioid image is simply a lot of straight lines drawn between specific points. So we are now in a position to draw the image.
First we nee to calculate the points. We need 200 points, equally spaced around a unit circle. The equation was given above, we just need to convert this to Python code.
We will store each point as an (x, y) tuple, and place all the tuples in an array points. Here is the code:
N = 200

points = [(math.cos(i*2*math.pi/N), math.sin(i*2*math.pi/N)) for i in range(N)]
If you are not familiar with list comprehensions you can ead about them here. This is the equivalent code using a loop - it does the same thing, less tersely, use whichever you prefer:
N = 200

points = []
for i in range(N):
    x = (math.cos(i*2*math.pi/N)
    y = math.sin(i*2*math.pi/N))
    point = (x, y)
    points.append(point)
Next, we need to produce a set of lines joining point[i] to point[i*2] (modulo N):
for i in range(N):
    j = (i*2) % N
    canvas.line(*points[i], *points[j])
(This requires Python 3.5 or later, because it uses the extended unpacking syntax in PEP 448).
This code goes into our draw function. We will also make minor changes to the makeImage function. The output filename is different, and the pixel size has been increased to 800 square. Here is the full code:
from generativepy import drawing
from generativepy.drawing import makeImage
from generativepy.color import Color
import math

N = 400

def draw(canvas):
    points = [(math.cos(i*2*math.pi/N), math.sin(i*2*math.pi/N)) for i in range(N)]
    canvas.stroke(Color(0.6, 0.6, 1, 0.25))
    canvas.strokeWeight(0.005)

    for i in range(N):
        j = (i*2) % N
        canvas.line(*points[i], *points[j])

makeImage("cardioid.png", draw, pixelSize=(800, 800), width=2.2,
          startX=-1.1, startY=-1.1, background=Color(0.25))
There is one final touch. The stroke colour is set to (0.6, 0.6, 1, 0.25). This is the previous light blue, but the fourth values makes the colour transparent. It has 25% opacity (ie it is 75% transparent). This means that where the lines overlap around the border of the cardioid shape, the colour looks brighter.