Sound waves
- Categories:
- sound synthesis
Sound, of course, is created when the air around us is disturbed. This creates variations in pressure that move through the air as a sound wave. Analysing how real sound behaves, not to mention how our ears detect sound and how our brains interpret sound, are vastly complex topics.
In sound synthesis, we usually simplify things by working with an abstract idea of a sound wave as a single, time-varying function. For example, this graph represents a sound that oscillates at 400 Hz (cycles per second) (see the article on frequency) and follows a sine wave shape:
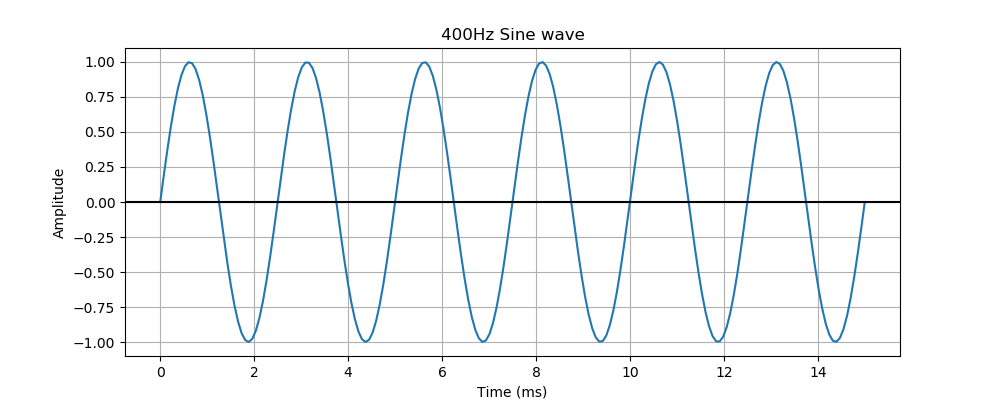
This graph could represent:
- A voltage, that varies in time.
- A digital signal, that is a list of sample values stored in computer memory.
- A pure mathematical function.
Any of these representations can be converted into a real, audible sound. The time-varying voltage can be fed into an amplifier and speaker to create a sound. The digital signal can be converted into a time-varying voltage by computer hardware (a DAC, or digital to analogue converter), which can also be fed into an amplifier and speaker. Even a pure mathematical signal can be calculated by a computer and used to create a digital signal that can be converted to a real sound.
For the purposes of understanding sound synthesis, in this section we will just think about the mathematical function, and we will always know that it can be converted to a sound.
Understanding the graph
The graph shows how the sound signal varies over time.
The y-axis indicates the signal value. The signal varies between values of +/- 1, with a centre value of 0. We will assume that +/- 1 is the maximum signal the system can handle. This is a nominal scale. The actual sound depends on the amplifier and speakers you use, and the volume you set.
The x-axis represents time. In this case, the scale is milliseconds (ms). One millisecond is a thousandth of a second.
The graph shows a signal that oscillates about zero, with a frequency of 400 Hz (that is, 400 cycles per second). One cycle of the waveform means:
- The wave starts at 0.
- It goes up to the maximum value +1.
- It goes down to the minimum value, -1.
- It returns to zero.
This is shown below, the graph shows a single cycle of the wave:
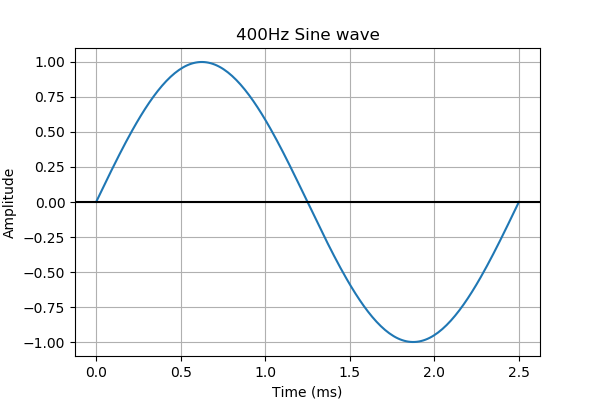
Since the wave cycles 400 times a second, we expect one cycle to take one 400th of a second. That is 0.0025 seconds, or 2.5 ms. The graph above shows that one cycle does indeed take 2.5 ms.