Newton fractal in generativepy
- Categories:
- generative art
- fractal
The Newton fractal is usually classified as an escape-time fractals like the Mandelbrot set.
In fact, in most cases, the Newton formula always converges towards one of several possible values. So rather than measuring the escape time we measure either:
- The value each point converges to.
- The time taken to converge on that root.
Newton-Raphson method
The Newton-Raphson method is used to find the approximate solution to equations of the form:
$$ f(z) = 0 $$
We will be using the formula:
$$ z^3 - 1 $$
This function is zero when z cubed is 1, so when z is the cube root of 1.
We know that the cube root of 1 is 1 (because 1 times 1 times 1 is 1). But if we allow complex solutions there are two more possibilities:
- 0.5 + 0.866i
- 0.5 - 0.866i
Where i is the imaginary number.
When we use the Newton-Raphson method, we must start with an initial value for z (which can be any complex number). Depending on the value of z, the equation will converge on one of the three solutions. We will apply the formula to all possible values of:
$$ z = x + iy $$
And marked the pixel (x, y) with a colour depending on which root it converges to.
You might expect the point x + iy to always converge on the closest solution. It usually does but in some regions it converges on a different solution, and the pattern forms a fractal.
Newton-Raphson formula
The formula for solving the equation:
$$ z^3 - 1 $$
is:
$$ z_{next} = z - \frac {z^3 -1} {3z^2} $$
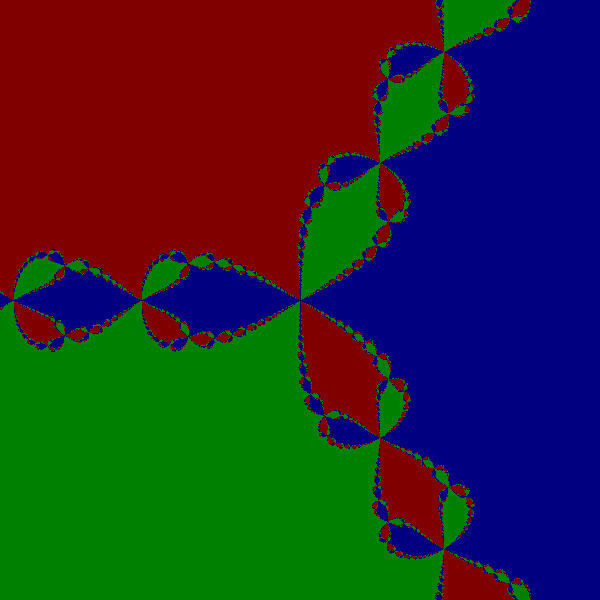
The full code
Here is the full code for the Newton fractal of z cubed:
from generativepy.bitmap import Scaler
from generativepy.nparray import make_nparray_data, save_nparray, load_nparray, make_npcolormap, apply_npcolormap, save_nparray_image
from generativepy.color import Color
from generativepy.utils import temp_file
from generativepy.analytics import print_stats, print_histogram
import numpy as np

MAX_COUNT = 100
BLACK = Color(0)
WHITE = Color(1)

ROOTS = [complex(-0.5, 0.866025),
         complex(-0.5, -0.866025),
         complex(1, 0)]

LIMIT = 0.01

def iterate(z):
    if z:
        return z - (z**3 - 1)/(3*z**2)
    else:
        return complex(0)

def converged(z):
    for i, r in enumerate(ROOTS, 1):
        if abs(z - r) < LIMIT:
            return i
    return 0

def paint(image, pixel_width, pixel_height, frame_no, frame_count):
    scaler = Scaler(pixel_width, pixel_height, width=3, startx=-1.5, starty=-1.5)

    for px in range(pixel_width):
        for py in range(pixel_height):
            x, y = scaler.device_to_user(px, py)
            z = complex(x, y)
            image[py, px] = 0
            for i in range(MAX_COUNT):
                z = iterate(z)
                root = converged(z)
                if root > 0:
                    image[py, px] = root
                    break


def colorise(counts):
    counts = np.reshape(counts, (counts.shape[0], counts.shape[1]))
    print_histogram(counts)
    colormap = np.array([(0, 0, 0), (0, 128, 0), (128, 0, 0), (0, 0, 128)])
    outarray = colormap[counts]
    apply_npcolormap(outarray, counts, colormap)
    return outarray


data = make_nparray_data(paint, 600, 600, channels=1)

filename = temp_file('newton-cube.dat')
save_nparray(filename, data)
data = load_nparray(filename)

frame = colorise(data)

save_nparray_image('newton-cube.png', frame)
The code defines the 3 ROOTS of the equation, and a LIMIT for detecting convergence.
The iterate function performs one iteration of the Newton formula. It has a special case for 0 to avoid divide-by-zero errors.
The converged function checks the z value against each root and returns the root number (1 to 3) if it is closer than LIMIT to a root. It returns 0 if the value is not close to any root.
The main paint function loops over every pixel in the image, creating a complex number z from the scaled x and y values for each pixel. The Scaler sets both x and y to the range -1.5 to +1.5.
For each pixel, the code iterates over the equation until it converges on a root, then sets the corresponding image cell to the value of the root (or 0 if it doesn't converge within MAX_COUNT iterations).
Finally, colorise converts the array of root numbers into actual colours. The colour map contains 4 entries - black for non-converging and green/red/blue for the three roots.
This code is available on github in blog/fractals/newton-cube.py.
Here is the image created:
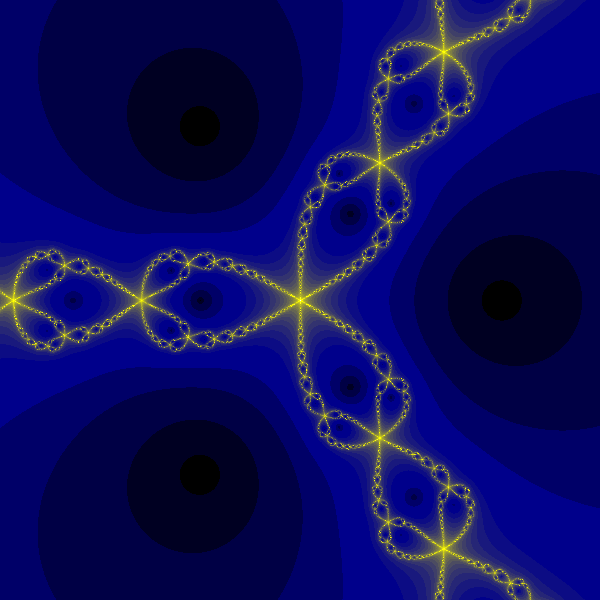
Variant - mapping convergence time
An alternative image can be created by counting how long it takes each point to converge. To do this we must modify the paint function:
def paint(image, pixel_width, pixel_height, frame_no, frame_count):
    scaler = Scaler(pixel_width, pixel_height, width=3, startx=-1.5, starty=-1.5)

    for px in range(pixel_width):
        for py in range(pixel_height):
            x, y = scaler.device_to_user(px, py)
            z = complex(x, y)
            image[py, px] = MAX_COUNT
            for i in range(MAX_COUNT):
                z = iterate(z)
                if converged(z) > 0:
                    image[py, px] = i
                    break
Rather than filling the array with the root, this fills the array with the loop count when the two converge. It defaults to MAX_COUNT
We also change the colorise function to use a range of colours.:
def colorise(counts):
    counts = np.reshape(counts, (counts.shape[0], counts.shape[1]))
    max_count = int(np.max(counts))
    colormap = make_npcolormap(max_count + 1,
                               [Color(0), Color('darkblue'), Color('yellow'), Color(1)],
                               [0.5, 2, 7])
    outarray = np.zeros((counts.shape[0], counts.shape[1], 3), dtype=np.uint8)
    apply_npcolormap(outarray, counts, colormap)
    return outarray
This code is available on github in blog/fractals/newton-cube-time.py.
Here is the image created: